Monday, May 10, 2010

The unluckiest lenders

The odds of getting repaid are very good. Only about 3.5% of loans default, and even then the chances are good you'll still get most of your money back. But with over 450,000 lenders there are bound to be some unlucky people. The unluckiest lender had all of her 9 loans default. She also had 11 refunded loans. Usually refunded loans aren't included in Kiva's numbers or in their API, but I noticed them on her lender page. At least those 9 loans repaid a significant fraction of the loan amount, so she probably got about 86% of her money back.

Here's a list of the number of lenders with 100% defaulted loans:
# Loans# Lenders
91
61
53
412
330
2264
14492


I like to tell people how awesome Kiva is, but these people probably tell their friends that Kiva is a huge failure. If I'm going to loan more money anyway, I might as well try to help two unlucky people at one time. I just sent a message to the unluckiest lender offering to send her a gift certificate to make a new loan; hopefully I can help change a statistic instead of just calculating it.

Thursday, October 8, 2009

#24 - Christmas Island?

Below are the top ten countries, ranked by the number of loans per country. (I'd rather use the dollar amount loaned, but that information is not available.)


Country# Loans%
United States1,603,06270.1%
Canada200,5548.8%
United Kingdom78,7353.4%
Australia66,3192.9%
Germany44,8152.0%
Netherlands39,5751.7%
France29,4791.3%
Norway28,0391.1%
Sweden21,9051.0%
Belgium21,7561.0%

The list is kind of what you would expect for an organization based in America, and mostly in English. But there are a few surprises. Since the lender's country is self-reported, there is certainly some bad data. For example, Antarctica is #91, with 62 loans from two people. The oddest result is Christmas Island, #24 with 3,408 loans, between Poland and United Arab Emirates. However, all of these loans are from one person, and based on his lender page I think
it's safe to say he's not from Christmas Island. It's interesting how much a single person can affect some of the metrics. With a minimum of $25 per loan, this is over $85,000 from a single lender! (More of top lenders later...)

Sunday, September 20, 2009

American Loans

I usually try to lend to the entrepreneurs in the poorest countries, to get the most use out of my money. And I think a lot of other people share this basic idea. That may be why so many people have issues with Kiva operating in America. (It's hard to gauge how upset people really are. I've seen complaints in different forums, but these may just be the same people who complain about any type of change.)

If you only have $25 dollars to spend, I think it's better to give it to someone in a developing nation than to someone in America. But not everybody looks at it that way. Many people strongly prefer to help a more local community, and Kiva is wise to try to grab that market. There are some other big players in Peer-to-Peer lending, and I think it makes a lot of sense for Kiva to compete with them.

I searched for micro-lending opportunities for a while before I found Kiva. I instantly recognized that their site and methods were incredibly easier and more fun to use than other organizations. And having worked with their data, I'm impressed with how clean and logical it is. In the areas I'm qualified to judge, Kiva is operating much better than most organizations. Expanding to new markets seems like an easy choice.

Saturday, September 19, 2009

Best and Worst Lending

The GDP ratio described in the previous post can be used to measure the efficiency of specific lending actions.

The most "efficient" loan made from Liechtenstein, $118000, to The Democratic Republic of the Congo, $300. I would guess that GDP breaks down at both ends of this scale. It's hard to count money when you're laundering it or if you're trying to recover from one of the worst wars in history. The actual ratio may be way off, but still, I'm sure that $25 is a lot more valuable in the Congo than in Liechtenstein.

There are plenty of "inefficient" loans, where someone in a poor country lends to someone in a rich country. Most of these seem to be people who entered the wrong Country. For example, I'm pretty sure there is no "New York, NY Afghanistan". (Google shows some possible explanations, but I'm still going with the theory that the information was entered incorrectly.) Excluding those lenders, the least efficient loan appears to be from Zimbabwe to Peru. If you thought lending from America to America was bad, try lending from a country where people earn the equivalant of $200 a year, to a country where people earn $8400.

Tuesday, September 15, 2009

Why Kiva is the best bang for your buck


This simple chart says a lot about why Kiva is so great. $88 million is the total amount of money loaned, as of a couple of weeks ago. That $88 million is mostly from developed nations. For example, the nations with the most lending actions are the US (70%), Canada (9%), and the UK (3%). To calculate what that money is really worth to the people who receive it, I took the per-capita GDP of the lender's country and divided it by the per-capita GDP of the entrepreneur's country. I used the purchasing power parity GDP, so it's not just an exchange rate calculation but an attempt at taking the cost of living into account. The average ratio is 19.7, which when multiplied by $88 million results in the incredible amount of 1.75 billion dollars.

There are certainly many possible issues with this calculation. How accurate are the GDP numbers? I used the values from the CIA factbook, but the values from the International Monetary Fund and the World Bank aren't drastically different. And what does per-capita GDP PPP really mean, and is it accurate to say that one US dollar is worth almost 30 times
as much in Kenya? And there are also some possible issues with the calcuation of the average. Kiva understandably doesn't release how much money each person lends, so I have to weigh the average based on the number of loans made per country, not the actual amount of money loaned.

But even if all my numbers are way off there's still a lot of room to spare in that $1.75 billion to still be impressive.

This is the main reason why I lend money through Kiva instead of giving money to local charities. By some measures, Kiva is clearly the most efficient use of my money. If all else is equal, I'd rather give millions of dollars than thousands of dollars.
Thursday, September 3, 2009

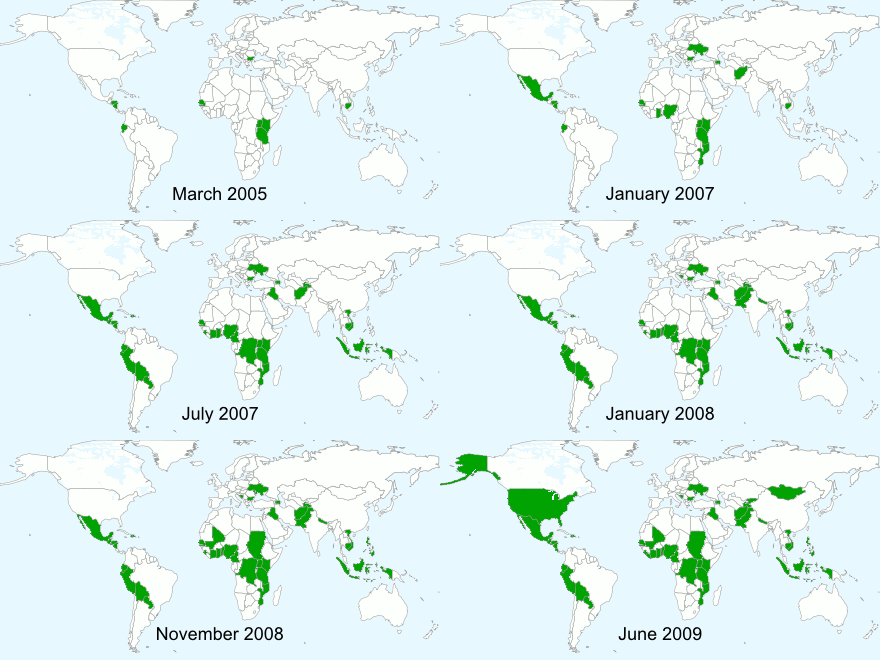
Kiva Growth

This animated GIF shows how Kiva has grown over time. I got this idea from animated GIFs on Wikipedia showing the rise and fall of empires. I like the idea of Kiva conquering the world.

The images were generated using Google Charts API, saved as individual files, and then animated using Inkscape and GIMP. Querying the data wasn't very difficult, but creating the animation was a lot harder than I had anticipated. I'd like to build more animated and interactive visualizations, but my skills in this area are weak. If there are any Kiva geeks out there with web or flash skills and an idea for some shiny new widget, I'd be happy to provide you with some data.

Introduction

On this blog I plan to post visualizations and information based on data from Kiva.org, an awesome micro-lending organization (that I am not affiliated with). Kiva released large amounts of data through publicly available APIs in the beginning of 2009, and I've been playing with their data for several months now. I've already put together charts, maps, statistics, and a SQL interface on my website, KivaData.org.

This blog is for introducing some new ideas, and hopefully generating some discussions about the information. My goal is to post some new information at least once a week. If there's any information you're curious about, please don't hesitate to ask. I am always looking for opportunities to collaborate with other people.